
Monday, September 30, 2013
finding a bottom...
I added to my /ES long this morning and have now traded out of it just keeping my original position. This helped lower my cost basis some. News of a govt. shutdown is just the type of thing that could put in a short term bottom. I still believe the path of least resistance will be higher for the next week or two. Sell the rips and buy the dips until then.
Thursday, September 26, 2013
Fake out...
Just what I was worried about. I've been stopped out for a point loss and I am now back long. If we close the hour back above 1688.75 I will expect a strong day tomorrow with a decent size gap higher to start the day. My lack of patience luckily only cost me a couple points. I am back to a long position @ 1690.

lack of upward movement probably means...
stock look destined to test the 1660-1670 zone. I am now short, realizing that there could a be a whipsaw in this area. As long as we stay underneath the 1688.75 hourly breakout zone, I will remain short.

Wednesday, September 25, 2013
Long /yg @ 1337 and /nkd @ 14650
Gold is headed back to 1450 where I will look to begin a short position. The Nikkei looks poised for a move towards 15500 as long as it hold today's lows. You could see big moves higher in these two by the end of the week.


Tuesday, September 24, 2013
Long /es @1692
After reviewing the charts of the /nq and /tf I have re-entered my long position in the /es. I think we will attempt to move back towards the recent highs around 1720. Because small caps and tech have been leading and are holding their short term support levels I think the risk/reward is skewed toward the bulls for the next couple of days.


Trader's market
Out of /ES longs @ 1691. I'm taking a wait and see approach. I will re-short a breakdown with the expectation of a move towards 1660. I think the market is still in the topping process and it will probably last until the 1st-2nd week of October with some sort of test of the recent highs. Until then it is a trader's market.
Long @ 1690
I've covered shorts and am long. It looks like the market is setting up for a re-test of the high
Monday, September 23, 2013
short /es @ 1696.50
Support seems to be breaking down. If it gathers some steam we could see the /es down 30+ today
covered /es short @ 1700
I think there will be a chance to re-enter shorts at better prices. All the equity futures are trading at support and look primed for some kind of bounce.
Wednesday, September 18, 2013
Couldn't ask for a better set up...
I've been patiently waiting the past couple weeks for a bearish set up to compliment the lifetime resistance and megaphone pattern that is currently in place for the Dow Jones Industrial Average. Today, courtesy of Ben Bernanke, I believe it has completed. The Dow and S&P 100 Index are both testing significant resistance areas on their lifetime charts and while there could be a couple more days of chop, the ball is back in the bear's court.


The Nasdaq 100 is also touching it's rising channel resistance.
 I believe gold could go higher until it reaches 1450 where, if rejected, it could pull back towards $1300 oz.
 All in all, this is as good as a chance to be leveraged short and even if the market manages to grind it out a few more days, the ensuing losses will take out months of gains.
The Nasdaq 100 is also touching it's rising channel resistance.
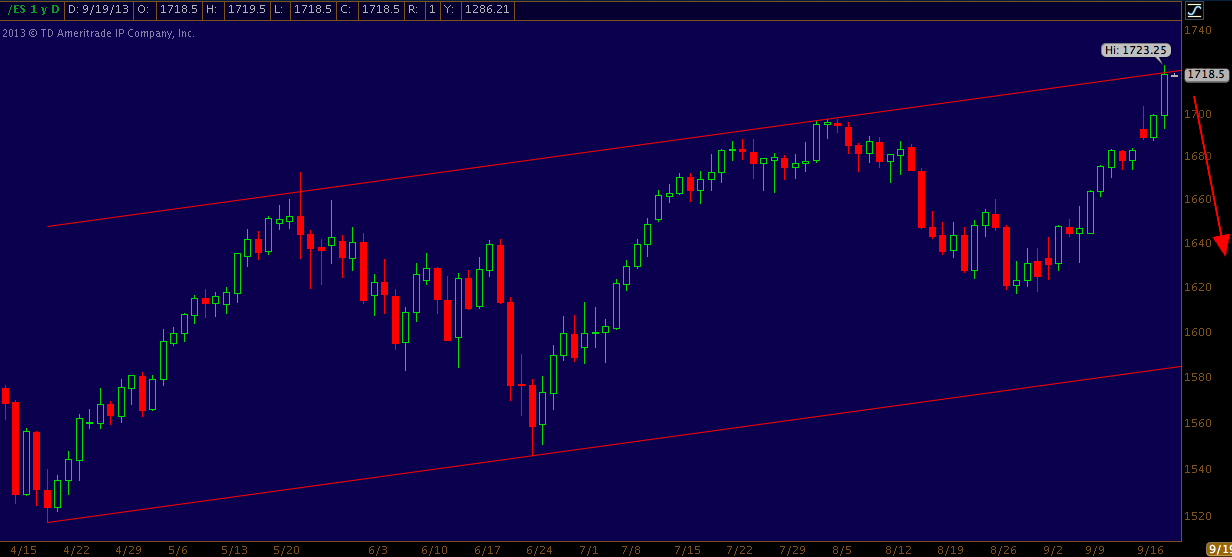
300% Short from /ES 1722.75
While there could be some chop near these levels the next couple of days the upside is over and we should see some severe selling very soon.
Sunday, September 15, 2013
The Stock Market Is Talking But Few Are Listening

The stock market is in the process of making a generational top.
The story is right there, directly in front of everyone's face. However, just like some of America's most infamous serial killers, it is hiding in plain sight. The gigantic, broadening top, aka megaphone pattern, in the major stock indices is like nothing ever witnessed by modern day traders or investors. While rare, these patterns are some of the most reliable in trading and are telling market participants an unthinkably frightening story. The definition below is from investopedia.com

One of the old adages of Wall Street is "they don't ring a bell at the top." Well, that might be true but Ms. Market is yelling at everyone through her megaphone that the bear is coming and his wealth destruction this time around will ruin the psyche of a generation or more of investors.
Before writing this post I did some minor searching to see if there was any mention of this ominous formation in the more mainstream financial sites. While I'm sure it is being talked about and discussed somewhere, I was unable to find any mention of the multi-decade megaphone pattern that has formed on all of the Dow Indices and is so profoundly obvious. Before I post the present day charts I wanted to post some previous tops that have occurred in this particular pattern. Keep in mind that none of the previous market tops were formed from a megaphone near the size that the current market faces.


These were all significant market tops. The 1929 and 1987 markets crashed. Perhaps the most frightening thing of all is that none of these broadening tops took more than few months or so to develop. As you will see in the following charts, depending on the index, some of the formations have been developing for decades.


The charts of these indices should be extremely sobering to anyone who says they are a technician. They are telling investors that the market will be embarking on a bear market journey that will probably be unlike anything in the modern financial era. While I do think there is some more work and time before the markets finally break, long term, passive investors have no business being invested in the stock market at this stage of the cycle. My work suggests that after this 1st decline of 12-15% there should be a higher high, probably in late spring/early summer 2014. That is when I expect this bearish pattern to exert it's force on the market.
With all the talk of a secular bond market decline along with several analysts who were bullish at the recent top and are now negative, bond prices should begin to outperform the market on a secular basis in the next couple of quarters.

Thursday, September 12, 2013
All things shiny...
I will elaborate more on this later but for a ST trade I am long gold via /YG @ 1635. My stop is right around 1620. The 1st chart is one that I have posted before but it has been several months. I believe gold will rally back to the horizontal dashed breakdown zone over the intermediate term. However, my expectation is 50-75 points over the next week or so.

 ps- I have limit orders to short the /ES @ 1695
Monday, September 9, 2013
Sunday, September 8, 2013
short /ES from 1657
Because of work, I have been unable to post anything since early last week. I wanted to post a quick update because I might not be posting again until Tues or Wed next week. I have marked the chart below to show where I shorted (circled with the arrow) and where my stop is.

Wednesday, September 4, 2013
long /es @ 1637.75 and /NKD @13915
I was stopped out of my /es short and put into a long position this morning. I believe that whatever resolution comes to Syria will be a good time to sell into strength and probably get back to the short side
Tuesday, September 3, 2013
200% Short /ES 1639
After seeing the final p/c numbers and noticing the /es inability to close the 4 pm hr above an important resistance level, I have decided to try the short side once again. If we do see an hourly close tonight above the 50% midline circled below then I will know that being long was the right decision. Unless that midline is crossed, I will be expecting a gap down and continuation move to the downside.


long /es @ 1637.50
As long as the market stays above 1636.25 I will favor the long side. Another reason I still favor the bulls for a few days is the Nikkei. Until it starts to break I think US equities could stay levitated. I also have an order to buy /NKD @13780.
Covered /ES short @ 1632.50
Waiting until the market can get back above 1636.25 to long or breaks down below 1627.50 to get short.
out of /ES longs. short from /es 1637
I got stopped out of /ES longs on the hourly close below 1640. I have some shorts on right now. If the market had been able to close where it opened today that would have been enough evidence to assume a daily cycle low was in for at least a few days. However, on this reversal it is beginning to look like we could finish flat or even down. If that happens the short case still has merit.
out of the other half of /NKD long @ 13865
out of the other half of /NKD long @ 13865
Monday, September 2, 2013
No war rally???
Japan has now broken out to the upside from the falling wedge formation I pointed out a few days ago. The /NKD was up 3% and 400 points today. My thinking that I had better get in or get left behind was correct. I expect the Nikkei will probably end up being double that by the end of the week. The SPX is also set to open higher tomorrow. As of now, it should open up 1% or more. I also think the SPX will have a great week with not many if any chances to get in. It would not surprise me if the next 5-10 trading days look very similar to 6/27/11 to 7/7/11. Not necessarily a move as high in percentage terms but a spike that does not offer any sell off to get in for those who would like to participate. Unfortunately, the market could do what it did after that time when the move higher terminates.


Sunday, September 1, 2013
no time to wait...
Because of the way I think this will unfold I moved my orders to get long up to /NKD 13450 and /ES 1641.75. I have been filled on both. I think there is a very good chance that the futures continue to trend higher into Monday morning. The rally may not last long but I think it could be good for 2% at a minimum. The Nikkei looks poised to explode higher. That is the index where the real money should be made next week.
Spoke too soon part 2...
On Friday I posted a chart of the small cap futures breaking down through support. However, I posted it with about 10 min left in regular trading. In the last 5 minutes of trading everything changed. Notice the volume in the /TF and /ES in the last 15 minutes of the day. Most of it came in the final few minutes of trading.

 After seeing this I knew I had some strong evidence that the markets could move up strongly before the stock exchanges opened back up on Tuesday. Literally, in the last minute of trading on Friday I did decide to cover my shorts but did not go long. As of now, I expect the market will rally for a few days and probably head back towards the previous swing high of SPX 1669, if not even higher. I have orders in to get long the /ES @ 1637.25 and the Nikkei via /NKD @ 13410.
Subscribe to:
Posts (Atom)