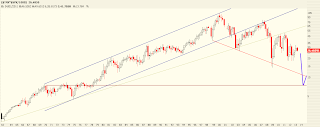
One of the the things that you notice immediately after reviewing the weekly charts is how all the markets for U.S. equities are pulling back from resistance. These are formidable resistance points so the price reaction should display that as the move lower unfolds.
Bonds are acting bullish again after holding support and look destined to test their former highs. The first chart is an hourly chart of the 30 yr Treasury Bond Futures. The formation that has been created is bullish and odds are that it ends in a breakout to new highs. The shaded circle is where I expect bonds to open on Sunday night.
High Yield Bond ETF-HYG
Those money managers talking about a bond bubble are sorely mistaken. The next chart is a ratio of the 10yr Treasury yield and S&P 500. This chart speaks volumes. Stocks are going down and bonds are going higher for the foreseeable future.
Volatility Indices
While the VIX closed within it's overhead resistance this past week the VXN and RVX both broke out from from theirs. Now that the slope of the VIX is positive it appears it will be flying high very soon.
Indicators
ETF Roundup
Be ready to buckle-up next week. It should be filled with plenty of volatility and wild swings!


No comments:
Post a Comment