
Friday, August 30, 2013
Small Caps leading the way....
Small cap futures are already telling you what to expect Sunday and Monday when the NYSE and Nasdaq are closed.


I spoke too soon...
Once again the whipsaws continue. I'm now short /nkd @13345 and /es @1641. I shorted both markets at the same time when the Nikkei broke down. Tomorrow should have some fireworks now.


Thursday, August 29, 2013
Long Japan (NKD) @ 13400 while waiting...
The other shoe has yet to drop for the US equity markets and those participants who have bet on a decline (for more than a few days) have been repeatedly disappointed for all of 2013. I have been as ready for an outlier move to the downside as I ever have in my trading career (especially since June) and that includes 2007 and 2008. While I still insist there will be a sharp, possibly very short move lower, I don't believe it will happen this week unless there is a major turn lower in the markets tonight. It looks like the SPX will try and test the recent swing high of 1669 in the coming days. As of now I think it will probably put in a slightly lower high and reverse. However, we will obviously have to see how the remaining trading days this week play out. I've gone long the /NKD earlier tonight because I think at a minimum, it is setting up for a move towards 14000 as the SPX attempts to rally towards 1660+. I mentioned yesterday how the Nikkei had two bullish formations, one inside the other. The first chart shows the large triangle pattern. These patterns usually resolve in the direction of the overall longer term trend (60%+). However, when they fail, the move in the opposite direction can be extremely violent. Hence, why I was warning of a potential crash yesterday. There is also a falling wedge within the larger triangle formation which is also a pattern that usually leads to bullish outcomes. The circled part of the chart below is the area of the falling wedge. Chart #2 is a daily close up of that wedge so that you can see it more clearly.

 The next chart is a 60 min chart of the wedge that gives even more detail.
 The next and last chart of the Nikkei shows you where I got long at a important intraday pivot. If this 13350-13400 level fails, the Nikkei should drop like a stone.
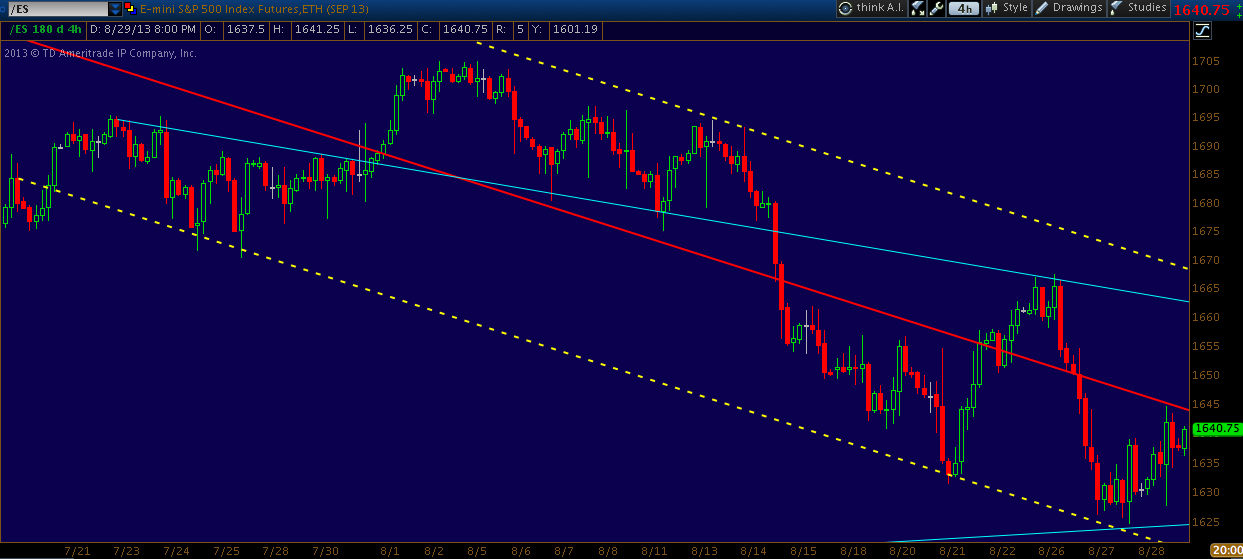
 The /ES and SPX are pretty simple at the moment. In the overnight session the /es is trading above key levels (1636.25) and is reinforcing my current thought process. That's why I went long the /nkd instead of the /es. I expect /nkd to put in a bullish hammer on the daily charts tomorrow. The following chart shows the /es and it's intraday resistance levels along with the pivot that caused the recent sell off. The last chart shows the mild daily support levels that capped this most recent turn lower in the cash index.



neutral
Last night's pop took me out of shorts in the /es and /nkd. The re-capture of 1632.50 and hourly close above 13500 were signs that today was going to be a continuation of the rally. I believe the jury is still out on the US markets. We are creeping back into some resistance at the 1645 area but with what looks like an upside break in the Nikkei, I'm inclined to think the US markets will have a bullish resolution. Only time will tell.
Wednesday, August 28, 2013
Put up or shut up time for the bulls...
Tonight could get ugly. The multiple hourly closes under the /es 1632.50 level should spell trouble. Not to mention the equity p/c ratio closed at a level that begs for a large gap down opening. If the market is going to break down the variety of indicators, divergences and long term charts are saying that there may not a better time all year than now.

 I will monitor the markets closely tonight. If 1632 is not re-captured on a hourly closing basis, the futures should start to slide lower. As long as the Nikkei doesn't close above the blue internal trend line I think it will drift lower in sympathy with the U.S. markets.
200% Short /ES @ 1631/Short /NKD @ 13450


200% Short /ES @ 1631/Short /NKD @ 13450
Long /es @ 1633.75
I'm taking another ST long position. I think the /es will trade up another 10 points from here over the next 12-18 hrs. I'm keeping a tight leash on this one with a stop just below the horizontal support line.


out of /es long @ 1636.25
I sold my /es long that I bought last night under 1630. It is now time to sit and wait.
Subscribe to:
Posts (Atom)