
Friday, August 30, 2013
Small Caps leading the way....
Small cap futures are already telling you what to expect Sunday and Monday when the NYSE and Nasdaq are closed.

I spoke too soon...
Once again the whipsaws continue. I'm now short /nkd @13345 and /es @1641. I shorted both markets at the same time when the Nikkei broke down. Tomorrow should have some fireworks now.


Thursday, August 29, 2013
Long Japan (NKD) @ 13400 while waiting...
The other shoe has yet to drop for the US equity markets and those participants who have bet on a decline (for more than a few days) have been repeatedly disappointed for all of 2013. I have been as ready for an outlier move to the downside as I ever have in my trading career (especially since June) and that includes 2007 and 2008. While I still insist there will be a sharp, possibly very short move lower, I don't believe it will happen this week unless there is a major turn lower in the markets tonight. It looks like the SPX will try and test the recent swing high of 1669 in the coming days. As of now I think it will probably put in a slightly lower high and reverse. However, we will obviously have to see how the remaining trading days this week play out. I've gone long the /NKD earlier tonight because I think at a minimum, it is setting up for a move towards 14000 as the SPX attempts to rally towards 1660+. I mentioned yesterday how the Nikkei had two bullish formations, one inside the other. The first chart shows the large triangle pattern. These patterns usually resolve in the direction of the overall longer term trend (60%+). However, when they fail, the move in the opposite direction can be extremely violent. Hence, why I was warning of a potential crash yesterday. There is also a falling wedge within the larger triangle formation which is also a pattern that usually leads to bullish outcomes. The circled part of the chart below is the area of the falling wedge. Chart #2 is a daily close up of that wedge so that you can see it more clearly.

 The next chart is a 60 min chart of the wedge that gives even more detail.
 The next and last chart of the Nikkei shows you where I got long at a important intraday pivot. If this 13350-13400 level fails, the Nikkei should drop like a stone.
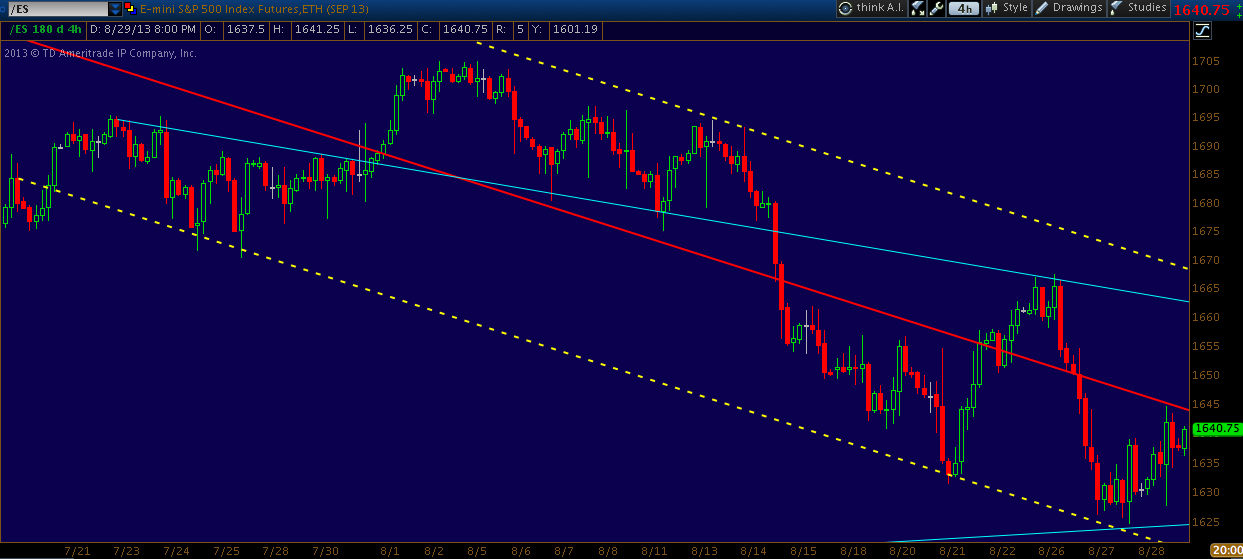
 The /ES and SPX are pretty simple at the moment. In the overnight session the /es is trading above key levels (1636.25) and is reinforcing my current thought process. That's why I went long the /nkd instead of the /es. I expect /nkd to put in a bullish hammer on the daily charts tomorrow. The following chart shows the /es and it's intraday resistance levels along with the pivot that caused the recent sell off. The last chart shows the mild daily support levels that capped this most recent turn lower in the cash index.


neutral
Last night's pop took me out of shorts in the /es and /nkd. The re-capture of 1632.50 and hourly close above 13500 were signs that today was going to be a continuation of the rally. I believe the jury is still out on the US markets. We are creeping back into some resistance at the 1645 area but with what looks like an upside break in the Nikkei, I'm inclined to think the US markets will have a bullish resolution. Only time will tell.
Wednesday, August 28, 2013
Put up or shut up time for the bulls...
Tonight could get ugly. The multiple hourly closes under the /es 1632.50 level should spell trouble. Not to mention the equity p/c ratio closed at a level that begs for a large gap down opening. If the market is going to break down the variety of indicators, divergences and long term charts are saying that there may not a better time all year than now.

 I will monitor the markets closely tonight. If 1632 is not re-captured on a hourly closing basis, the futures should start to slide lower. As long as the Nikkei doesn't close above the blue internal trend line I think it will drift lower in sympathy with the U.S. markets.
200% Short /ES @ 1631/Short /NKD @ 13450


200% Short /ES @ 1631/Short /NKD @ 13450
Long /es @ 1633.75
I'm taking another ST long position. I think the /es will trade up another 10 points from here over the next 12-18 hrs. I'm keeping a tight leash on this one with a stop just below the horizontal support line.


out of /es long @ 1636.25
I sold my /es long that I bought last night under 1630. It is now time to sit and wait.
sold /NKD @ 13410
After almost 100 points I decided to sell my long in the Nikkei. Things are still not clear enough to take a position either long or short for anything other than a ST trade. I am going to try and get some sleep before the open tomorrow. I am still long the /es but am looking to exit it as well.
Trying to bounce...
I was stopped out of my /NKD and /ES shorts. I am actually long the /NKD @ 13315. We'll have to wait and see if this move is for real or just a pop before the puke. The chart below shows where I think it's going in the short term. The dashed horizontal line is where my stop and entry to get long was. The solid horizontal line is where I think prices could go in the next day or two.
 edit: I am also long the /es @ 1631.75. Even though I was wrong about the VST, I am not a believer that this correction is over. The /NKD is it's own animal but I don't trust the /ES. I have a limit order to sell @ 1636.25. In the morning I will see what's happened and then re-evaluate.

Tuesday, August 27, 2013
Projected path of the Nikkei
If the Nikkei breaks below 13200 again, the chart below shows it's most likely path. Assuming the break down occurs, the selling won't stop until 11500-11750. If the move lower starts tonight there will only be 2-3 days max to get out before a crash. Nothing is a sure thing and as I stated earlier if the /NKD can hold these levels, instead of crash, a huge move higher will happen very quickly. The set up that is in front of market participants, concerning the Nikkei, is a rare one. Whether up or down, a huge move will start soon.


The Nikkei's future is in the here and now...
I might have jumped the gun earlier shorting /NKD. There is still one last chance for the Nikkei to switch gears and have another huge rally. We should literally know within 2 days. The first chart is a one year chart of the Nikkei futures.

As you can see after the huge run up from last year the Nikkei has now formed a giant triangle pattern. These patterns usually resolve in the direction of the trend, which in this case, is up.
 This next chart is of a falling wedge that has formed within the even larger triangle pattern. As you can see the /nkd is hanging on by a thread. The bottom line is that we have a bullish pattern within a bigger bullish pattern. If the /nkd closes below today's close, it will crash. There are no if's and/or but's about it. If it can hang on and rally from here a break out of this falling wedge could send it screaming higher. Whichever the result, it will become clear within 48 hrs.


Short /ES @ 1628
The inability of the market to move higher after hours has made me reconsider covering my short earlier. While extremely oversold I think 1620 is likely to happen sooner rather than later. I will cover if the market reverses and trades above 1630. The pic below shows how oversold the /es is but the lack of buying interest here tells me that another gap down open is looking more likely.


covered /es short @ 1628.50
some intra-day indicators I look at are extremely oversold. This is why I covered my short a few minutes ago. The picture of the TRIN/Q shows why I covered. If the market does not bounce in the next 24 hours, that will tell us all we need to know. For now, the safe play is to wait and see how we trade tonight and tomorrow morning.


short @ 1636.25
The /es needs to close below this level in the next hour or so. If not, there could be a sharp move higher over the next day or two. As of now I believe the market is vulnerable to a move lower that probably ends around 1615-20 in the /es


Monday, August 26, 2013
long @ 1652.25 for a ride to 1670
The backtest of a trendline by the /es has me vst bullish. I believe that a test of 1670-75 will happen by Wed. However, I am very bearish looking out over the next 4-6 weeks so I will not mess around if the market continues to slide overnight. IMO, the downside should be limited to /es 1649 or so. I will exit if the market trades much lower than that.

No Volume=No Selling...
Sorry for my schizophrenia. Volume is so abysmal that there is virtually no way any move lower can occur today. While not a large volume bar the area that the /es is trading above is holding as support. Any move lower will have to happen overnight to build momentum and then when the selling starts volume should increase exponentially. Im taking a quick 1/2 pt. and waiting to re-short back at my original target area of 1670-75. I believe that we will probably get there between tonight and tomorrow's open. Out of shorts @1663.50


short from /ES 1664.25
After taking a second look at things I decided to go ahead and put on shorts in this area. I will add to positions with the /nq if my target of /es 1670-75 is met. I am beginning to think that this bounce could be taking a very quiet and graceful exit today.


out of longs @ 1666 & 1665.75 from 1655.50
The /es has entered a major resistance zone. I will look to enter shorts soon. Probably somewhere around 1670. The 1st chart is why I exited longs and the 2nd is where I am looking to re-enter short positions.


Friday, August 23, 2013
closed /es short @ 1655.5
With the hourly close in the /es @ 1658.5 after falling as low as 52.50 has set the market up to make a run towards /es 1670. I got long where I covered and have a stop just below the low at 1652.50
wait and see...
Im out of longs and short again @1659. If there is an hourly close above this level then 1670 could happen quickly.


Wednesday, August 21, 2013
long @ /es 1645.75
Pretty simple. The markets hold this bottom and we go higher. If it breaks the market should drop 30


covered short @ /es 1645...
I'm waiting for regular trading hours to decide my next move. This late night break lower looks to be stabilizing
Tuesday, August 20, 2013
Looking ugly after hours...
The inability of the market to hold the backside of the ST trendline shown below has caused me to close out my ST long and get back to the short side, once again. The steady drift lower after hours has the making of a potential nasty gap lower in the morning that should beget more selling once the market opens for regular trading. I have stops placed @ 1650.50 and will consider getting long again if this turns out to be another head fake. Short from 1647.50


added to st long...
I know I said I had a stop @ 1650.25 but I added at these levels and moved my stop down another 1.5 pts because of the vst support the /es is trading at.


ST Long @ 1654.75
I have a stop @ 1650.25. Looking to grab 6-7 pts profit between now and tomorrow's open
What's coming next?
Getting flat in a market that is not acting quite how you think it should, is always a smart move. That's what I did this morning after getting whipsawed long and short over the past 24 hrs. Now that I have had a chance to get a new, unencumbered view of the markets, a clear path has re-appeared. As oversold as the market was at yesterday's close, I believe that today and tomorrow SHOULD be huge up days. However, the clues that I am spotting in today's market action are suggesting to me that there is more downside ahead, starting as early as tomorrow. I will be using /es 1670 as my uncle point and will probably start adding to the short side again in the low 1660's. There is a lot of technical resistance in that area and I believe that is where serious selling will re-enter the market.


Back to neutral
After some whipsaws around the 1650-1640 area, I'm back to neutral. I will do an update with charts later today. I want to see how the markets close today.
Monday, August 19, 2013
Back to the short side..
The market's inability to hold certain price levels leads me to believe that tomorrow could be an ugly, downside break. Probably 30-40 points on the SPX, at a minimum. I'll post some charts later today to show why today's break should be ST bearish.
Friday, August 16, 2013
Dow holding support. Could see a pop early next week...
I've switched to a ST bullish position because of the support level the Dow Jones Industrials are holding. As long as the market holds the 15050 level into the close I will remain long for a potential move towards the May highs. 200% long /ES @ 1653

Thursday, August 15, 2013
Sold the remainder of Sept 26 GDX calls @ $3.50
If I owned the etf I would probably hang on to some. However, I expect the volume spike circled on the chart below will provide resistance for several days, possibly weeks. $29-30 could contain prices for the foreseeable future.

Slowly moving to the downside...
Today's downside break does not have the volume and fear in it that I would like to see. Could be nothing but it's something I'm paying attention. However, for safety's sake, I cut my leverage down a 1/3 and covered some /ES @ 1660 (from 1704.5). I also unloaded 1/2 of my Sept 26 calls in GDX @ 3.20. The next few days will let us know if this decline is for real or not.
edit: I must have been looking at something different but I take back my earlier comment about volume. The volume up until this point (8am-10am) is the highest it's been in weeks
edit: I must have been looking at something different but I take back my earlier comment about volume. The volume up until this point (8am-10am) is the highest it's been in weeks
Saturday, August 3, 2013
S&P 100 and Small Cap Volatility
The long term internal trend line that initiated the sell off in May is being tested again. On a cycle basis, I mentioned a few weeks ago that the first week in August was when the next top was due. With declining breadth and small cap volatility at weekly support, along with the OEX at resistance, the seeds have been sown for a 12-16% decline. After the sell off, I believe there is enough evidence to support the yearly cycle low for the market in the Sept-Oct time frame. At that point, there should be one more higher high in the spring of 2014. After the decline starts, I'm sure more clues to the future will begin to emerge.
Monthly
 Weekly
 RVX Weekly
 RVX Daily
 I am now 300% short from /es 1684.50. IMO, this will be a move lower much like the summer 2011. Probably not as vicious a move lower but similar nonetheless.
Monthly
Subscribe to:
Posts (Atom)